

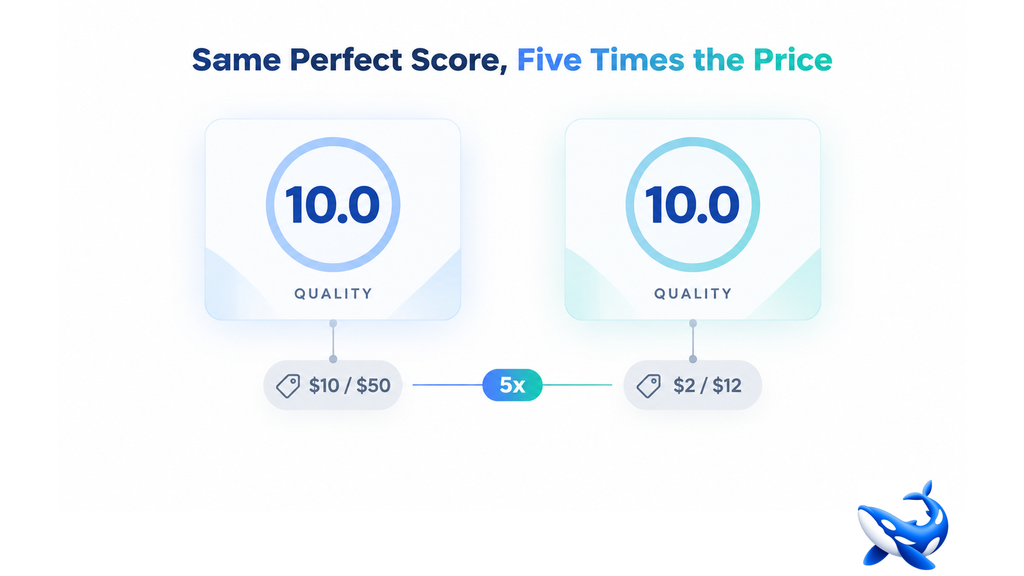
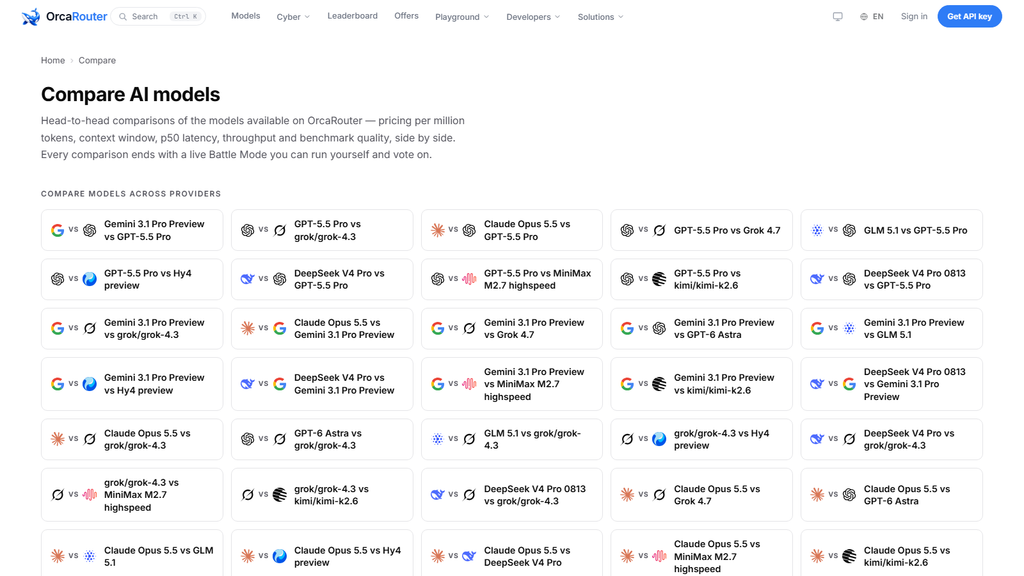
Two models on the same comparison table can carry the same perfect quality score and still be five times apart in price, and the score alone will not tell you which one you should pay for. On OrcaRouter the llm comparison page prints twelve rows with a 0-to-10 quality column next to the price columns, and the top of that quality column is crowded: Gemini 3.1 Pro Preview and Claude Fable 5.1 both land on a perfect 10.0.
The 10.0 is the same. The rate cards underneath it are not. One of those rows charges $10 per million input tokens and $50 per million output; the other charges $2 and $12. A score that coarse and a price that far apart on the same row of the same table means the quality column is doing a different job than you might think.
What the 10.0 actually is
The quality score on our comparison page is a composite we build ourselves: we grade each model across our own quality dimensions and fold them into a single 0-to-10 number. It is our measurement, not a third-party benchmark, and it is deliberately coarse. Ten buckets for twelve models means most of the table shares a digit — indeed, eleven of the twelve rows land between 8.0 and 10.0 — and a composite that fine-grained cannot do the work of a full review. What it can do is tier: it tells you which rows belong at the top of the field and which sit a rung below, and it tells you that without pretending the two perfect rows are interchangeable.
They are not interchangeable, and the composite was never designed to say they were. Claude Fable 5.1 reaches its 10.0 with one set of strengths; Gemini 3.1 Pro Preview reaches the same 10.0 with another. The single digit tells you they both clear a high bar. It does not tell you which bar you are actually crossing, and that is the job the rest of the columns take up.
The same digit, two very different bills
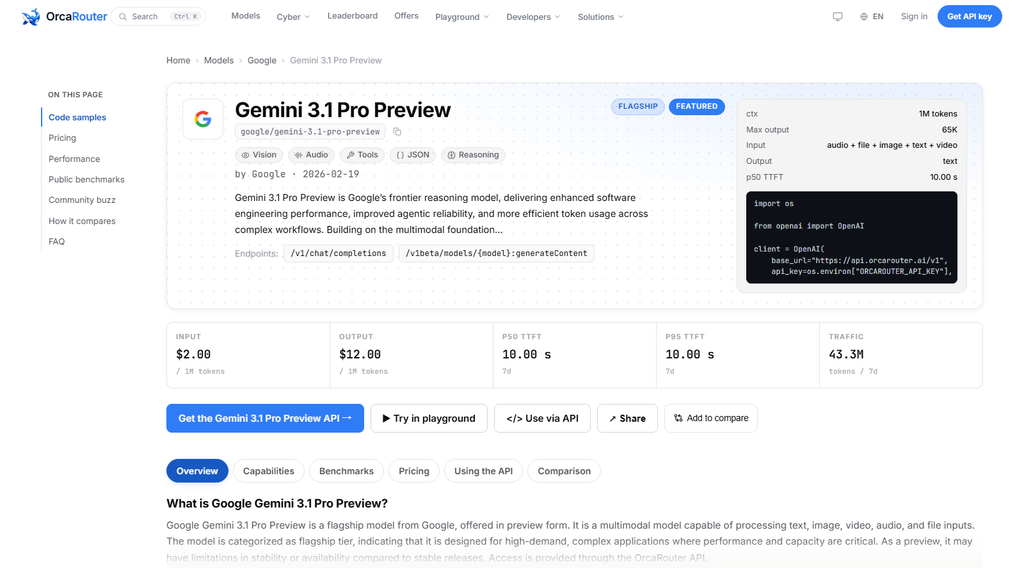
Put the two perfect rows next to each other and the price columns do the differentiating. Claude Fable 5.1 costs $10 per million input tokens and $50 per million output, both at a 5.0-times multiplier, with a one-million-token context window and a 3.98-second p50 time-to-first-token in our production telemetry. Gemini 3.1 Pro Preview costs $2 per million input tokens and $12 per million output at a 6.0-times multiplier, also with a one-million-token window, and its p50 sits pinned at the 10.00 second ceiling in the same telemetry — the measurement ceiling, not a genuine latency, which is exactly why the same value appears on most rows in the table.
On input, Claude Fable 5.1 is exactly five times the price of Gemini 3.1 Pro Preview. On output it is about 4.2 times. Same perfect score, five times the price: the quality column cannot see the difference, because it was never looking at it. A budget that fits a $2-per-million input row is a very different budget from one that fits $10 per million, and the team that picks on the score alone has skipped the half of the table that actually prices their workload.
What the composite does for you anyway
None of that makes the quality column useless; it makes it positional. Its real job is to set expectations before the arithmetic starts. When a row carries a 10.0, it is telling you that at least on the dimensions we grade, it is a flagship-tier model and price is the main thing standing between it and a default choice. When a row carries an 8.0, it is telling you the opposite: expect a real capability gap on at least one dimension you might care about, and look for the price to compensate.
Used that way, the composite is a filter, not a verdict. It shortlists the top of the field and then hands the decision back to the columns that carry actual numbers — the input price, the output price, the multiplier, the context window, the latency, and the seven-day traffic. The 10.0 does not answer “which should I buy”; it answers “which rows are even in the conversation,” and those two questions get confused far more often than they should.
Where the perfect rows split
Read down the rest of the table and the two 10.0 rows keep diverging. Gemini 3.1 Pro Preview’s 6.0-times multiplier is the pricing shape of a reasoning-heavy card, while Claude Fable 5.1’s 5.0-times multiplier on a more expensive base is the shape of a premium flagship sold on capability, not volume. The seven-day traffic column shows which way the market leans: Claude Fable 5.1 has carried 7.4 million tokens of production traffic on our side in the trailing seven days, while Gemini 3.1 Pro Preview has carried 42.8 million. The cheaper of the two perfect rows is nearly six times busier, and a market that votes with tokens has already priced the same score in two very different directions.
Paying five times for the same digit
There is a reasonable case for paying five times as much for a model that scores the same as a cheaper one, and it has nothing to do with the score. Teams pay the premium when the expensive row is stronger on the specific dimension their workload feeds — when their traffic is the kind of request where the composite average hides a decisive difference. Claude Fable 5.1’s 81.6 coding index, first place out of 138 on an independent leaderboard, is that kind of dimension: a code-heavy team can justify $10 per million input for a row that leads a coding board the way that number leads it. Gemini 3.1 Pro Preview has no such coding story on the same board, and a team that never writes code should not pay the coding premium by accident.
The failure mode is the reverse: buying the expensive row because the cheap one looks equal on a composite that was never built to tell them apart. A 10.0 on our quality column is a statement that a model is in the top tier. It is not a statement that two 10.0 rows are the same purchase, and it is not a waiver on the five-fold difference between their invoices. When two perfect scores sit on the same table with that gap between their prices, the score has finished its job — and the rest of the table has to finish yours.
The takeaway
Gemini 3.1 Pro Preview and Claude Fable 5.1 both score a perfect 10.0 on our quality composite — the number we build ourselves by grading each model across our own quality dimensions, never a third-party benchmark. Their rate cards could not look less alike: $2 in and $12 out against $10 in and $50 out, five times the input price and about 4.2 times the output.
A composite is a filter, not a verdict. Use the quality column to see which rows belong at the top of the field, then price your workload against the columns that carry real numbers — and when two rows share a digit but sit five times apart on price, let the score do its job and stop there.
Sourcing note: all prices, multipliers, context windows, p50 time-to-first-token figures, composite quality scores and seven-day token volumes are OrcaRouter production data from the comparison page and the linked model page, read 2026-10-12. The 81.6 coding index figure is from an independent leaderboard of 138 models, read 2026-10-12, and will drift. The composite quality scores are our own, built by grading each model across our own quality dimensions. The 10.00 s value for Gemini 3.1 Pro Preview is the measurement ceiling. All checked 2026-10-12.
